Technical analysis is a trading method that uses past price and volume data to predict future price movements. It is based on the assumption that market behavior repeats itself and that historical price and volume data can be used to identify patterns that will predict future price movements. Technical analysis and candlestick charts go hand-in-hand.
In fact, candlestick charts are one of the most popular ways to do technical analysis. They give you a good overview of price action and can be used to make predictions about where prices are headed. Keep reading to learn more about candlestick charts and how to use them.
Candlestick Charts
Candlestick charts are one of the most popular ways to represent price data on a chart. The candlestick chart was developed in Japan and is still used extensively in that country. However, it has become increasingly popular in other parts of the world as well.
The candlestick chart consists of a body and two wicks, also called shadows. The body is the rectangle between the open and close prices. The wicks are the thin lines extending from the top and bottom of the body. If the close price is higher than the open price, then the body will be filled in with color, usually green. If the close price is lower than the open price, it’s typically filled in with red.
How to Read a Candlestick Chart

There are numerous things that you can look for when reading a candlestick chart.
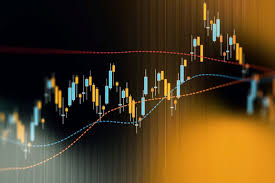
The first thing to look for in the direction of the candlesticks. A candlestick is considered bullish when the body is green and the close is higher than the open. A candlestick is considered bearish when the body is red and the close is lower than the open.
The next thing to look for is the size of the candlesticks. A large candlestick indicates that there was a lot of buying or selling pressure during the given time period. A small candlestick indicates that there was not a lot of buying or selling pressure during the given time period. The last thing to look for is the shape of the candlesticks. A bullish candlestick is typically a long green candle, and a bearish candlestick is typically a long red candle.
Using Chart Patterns in Technical Analysis

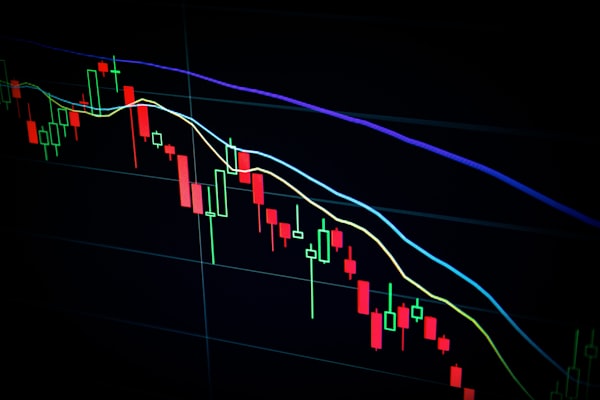
Chart patterns are graphical formations on a price chart that suggest a change in the trend. The most common patterns are reversal patterns and continuation patterns. Reversal patterns indicate that the current trend is about to end, while continuation patterns suggest that the current trend will continue.
There are many different types of chart patterns, but some of the most common include head-and-shoulders, double tops or bottoms, flags or pennants, and wedges. Each type of pattern has specific characteristics that traders look for when trying to identify potential trading opportunities.
For example, head-and-shoulders is a reversal pattern that typically forms at the top of an uptrend and signals that a downtrend is likely to follow. Double tops or bottoms form after an uptrend or downtrend has been in place for some time, and signal a possible reversal in trend.
Flags or pennants are short-term continuation patterns that form after an initial directional move and suggest further upside or downside momentum ahead. Finally, wedges are also continuation patterns but can be either bullish or bearish depending on their orientation.
Traders use various techniques to confirm whether a chart pattern is actually forming, including looking at volume levels, moving averages, and breakout points. Once a pattern has been confirmed, traders often enter into a trade in anticipation of the anticipated move based on the direction of the prevailing trend.
Using Candlestick Charts for Technical Analysis
Candlestick charts and technical analysis are two important aspects of trading that should be considered when making any investment decisions. Together, they provide a comprehensive view of the market and can help traders make informed decisions about their trades.